
Monday, September 7
Late Summer Sunshine with Localized Mountain Drizzle
A strong ridge of high pressure will dominate the Commonwealth, bringing widespread sunshine and late-summer warmth. The only exception will be the Southeast Coalfields, where shallow moisture may lead to early-day drizzle before clearing.
Confidence Assessment
Confidence is high for a dry and warm day for 90% of the state due to strong model agreement on the ridge position. The lower score reflects the 5-day lead time and the typical uncertainty regarding terrain-induced clouds in the eastern mountains.
Get Personalized Forecasts
Choose which region in Kentucky you're interested in and we'll always show you that one first. You can change your selected region by clicking the "Star" icon on any regional forecast.
Purchase Area
Expect a hot and sunny day with temperatures reaching the lower 90s. Skies will stay completely clear through the evening.
Northwest Pennyrile
Plenty of sunshine is expected with temperatures peaking in the upper 80s. A light breeze will provide minor relief.
Southwest Pennyrile
A beautiful day with clear skies and high temperatures in the high 80s.
Barren River
Temperatures will be warm and the air will remain dry. Highs will settle in the upper 80s.
Louisville Metro
A great day for the city with clear skies and highs in the mid-80s.
Lincoln Trail
Highs will reach the mid-80s under wall-to-wall sunshine.
Lake Cumberland
Light winds and bright sun make for a perfect lake day with highs near 86.
Northern Kentucky
The coolest part of the state, but still beautiful with highs in the lower 80s.
Inner Bluegrass
Brilliant sunshine with mid-80s and light winds for Lexington and surrounding areas.
Bluegrass Foothills
Expect sunny skies with highs in the mid-80s. A few flat clouds may appear late.
Northeast Kentucky
Morning valley fog will clear quickly, leaving behind a sunny and warm afternoon in the mid-80s.
Southeast Kentucky
A damp start with some light drizzle and low clouds is expected. Skies will gradually clear into the late afternoon with accumulations around 0.02 inches.
Possible Outcomes
Weather forecasting involves uncertainty. Below are two scenarios representing the range of possible outcomes: the "Boom" scenario shows the worst-case/highest-impact result if conditions align unfavorably, while the "Bust" scenario shows the best-case/lowest-impact result if the forecast doesn't materialize as expected.
The 'Boom' Scenario
If the GFS solution for the western ridge verifies, high temperatures in the Purchase region could reach the mid-90s, while the moisture in the east remains too shallow for any drizzle, leading to 100% sunshine statewide.
The 'Bust' Scenario
If the ECMWF's low-level moisture trap is more robust, the Southeast Coalfields could remain socked in with low clouds and drizzle for most of the day, holding high temperatures in those valleys to the upper 70s.
Model Disagreements
When models disagree, a call must be made to determine the most likely outcome. This decision is based on a combination of factors including model performance, historical data, and the models general accounting of each climatic region of Kentucky.
The Southeast Moisture Trap
The ECMWF identifies a high-probability (80%) light drizzle event for the Southeast Coalfields driven by upslope flow and trapped 1000-850mb moisture. The GFS ignores this, forecasting a completely dry column due to its coarser resolution of terrain-induced moisture pooling.
Why EURO Wins
The ECMWF typically handles 'dry slots' and shallow boundary layer moisture in complex terrain better than the GFS, which tends to over-simplify mountain-valley moisture dynamics.
Western Heat Intensity
The GFS is significantly more aggressive with afternoon heating in the Western Purchase area, suggesting highs of 93F, whereas the Euro remains more conservative at 89F.
Why UNCERTAIN Wins
While GFS often over-heats during dry spells, the strong subsidence under the ridge center supports the higher end of guidance; a blend is the safest path.
Celestial Almanac
Waning Crescent
Purchase Area
Northwest Pennyrile
Southwest Pennyrile
Barren River
Louisville Metro
Lincoln Trail
Lake Cumberland
Northern Kentucky
Inner Bluegrass
Bluegrass Foothills
Northeast Kentucky
Southeast Kentucky
Forecast Charts
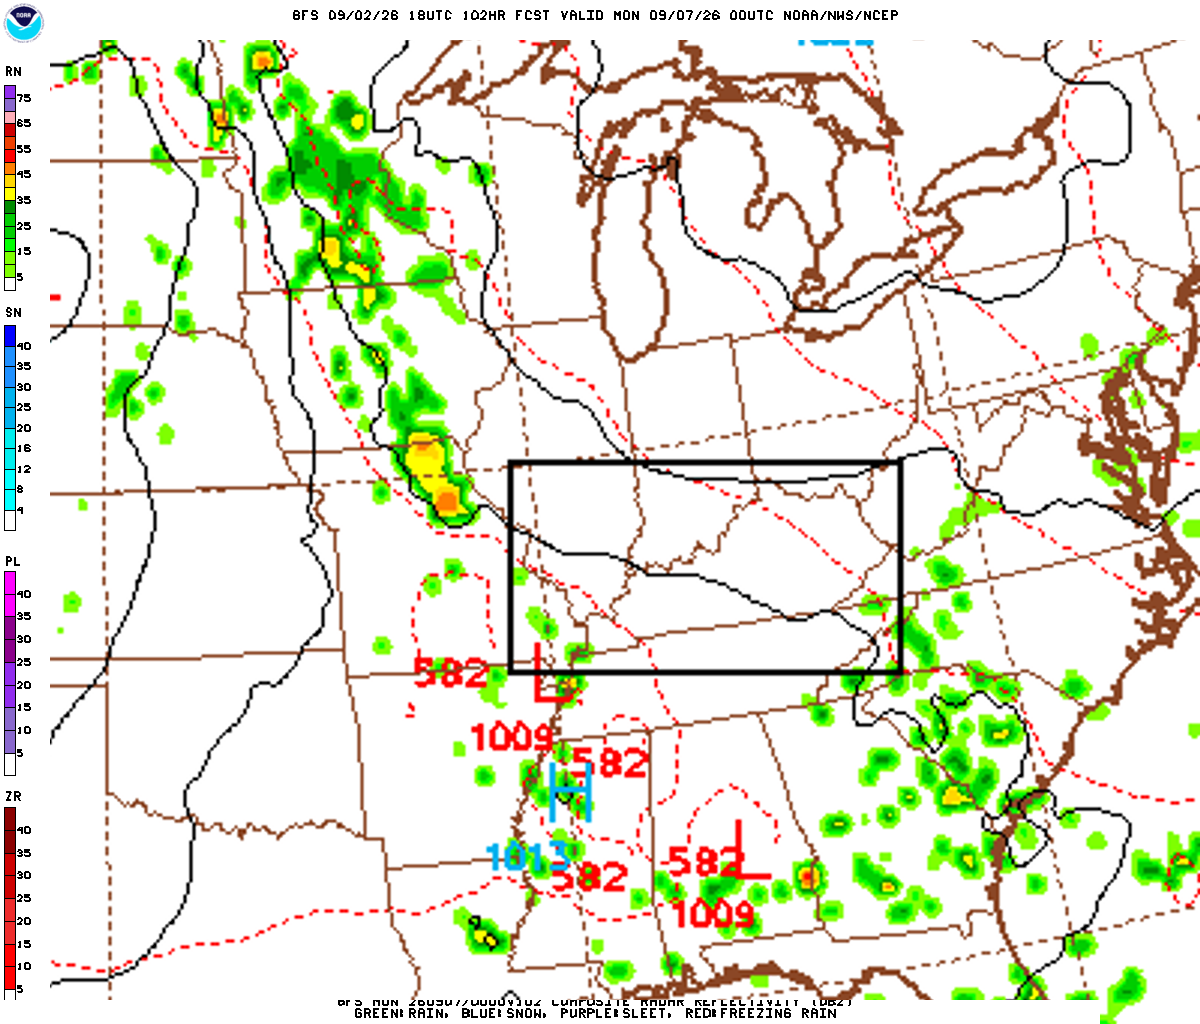
These maps are generated by the weather agencies based on the raw data that the weather models predict. The final forecast is generated using the same raw data shown on the map. Keep in mind that the models (and therefore the maps) will generally disagree on specific parts of the forecast. Use these as guidance - not as a final prediction.
Dive Deeper Into the Models
This forecast is a synthesis of raw data from the NAM, GFS, ECMWF, and GEM models. These models provide detailed atmospheric analyses including 500mb vorticity, precipitation rates, and more. You can take a look at the raw model data by clicking the links below.