
Thursday, September 3
NWS Alerts Active This Day
Heat Advisory
Heat Advisory issued September 2 at 1:40PM EDT until September 4 at 8:00PM EDT by NWS Charleston WV
WHAT Heat index values up to 104.
WHERE Portions of northeast Kentucky, southeast Ohio, and central, northern, southern, and western West Virginia.
WHEN Until 8 PM EDT Friday.
IMPACTS Hot temperatures and high humidity may cause heat illnesses.
Drink plenty of fluids, stay in an air-conditioned room, stay out of the sun, and check up on relatives and neighbors. Additional information can be found at https://www.weather.gov/rlx as well as on our X and Facebook pages.
Extreme Heat Warning
Extreme Heat Warning issued September 2 at 1:12PM CDT until September 5 at 8:00PM CDT by NWS Paducah KY
WHAT Dangerously hot conditions with heat index values 105 to 110.
WHERE All of southern Illinois, southwest Indiana, western Kentucky, and southeast Missouri.
WHEN Until 8 PM CDT /9 PM EDT/ Saturday.
IMPACTS Heat related illnesses increase significantly during extreme heat and high humidity events.
Drink plenty of fluids, stay in an air-conditioned room, stay out of the sun, and check up on relatives and neighbors. Take extra precautions when outside. Wear lightweight and loose fitting clothing. Try to limit strenuous activities to early morning or evening. Take action when you see symptoms of heat exhaustion and heat stroke. Stay cool, stay hydrated, stay informed.
Heat Advisory
Heat Advisory issued September 2 at 2:40PM EDT until September 4 at 8:00PM EDT by NWS Louisville KY
WHAT Heat index values between 100 and 107. Limited nighttime relief as low temperatures are only expected to fall into the low-to-mid 70s.
WHERE Portions of south central Indiana and east central, north central, northwest, and south central Kentucky.
WHEN Until 8 PM EDT /7 PM CDT/ Friday.
IMPACTS Prolonged hot temperatures and high humidity may cause heat illnesses.
Drink plenty of fluids, stay in an air-conditioned room, stay out of the sun, and check up on relatives and neighbors. To reduce risk during outdoor work, the Occupational Safety and Health Administration recommends scheduling frequent rest breaks in shaded or air conditioned environments. Anyone overcome by heat should be moved to a cool and shaded location. Heat stroke is an emergency! Call 9 1 1.
Heat Advisory
Heat Advisory issued September 2 at 3:58PM EDT until September 3 at 8:00PM EDT by NWS Jackson KY
WHAT Heat index values of 100 to 105 degrees expected.
WHERE Portions of northeast and southeast Kentucky.
WHEN From 11 AM to 8 PM EDT Thursday.
IMPACTS Hot temperatures and high humidity may cause heat illnesses.
Drink plenty of fluids, stay in an air-conditioned room, stay out of the sun, and check up on relatives and neighbors.
Heat Advisory
Heat Advisory issued September 2 at 3:58PM EDT until September 3 at 8:00PM EDT by NWS Jackson KY
WHAT Heat index values up to around 105 degrees expected.
WHERE Portions of east central, south central, and southeast Kentucky.
WHEN Until 8 PM EDT Thursday.
IMPACTS Hot temperatures and high humidity may cause heat illnesses.
Drink plenty of fluids, stay in an air-conditioned room, stay out of the sun, and check up on relatives and neighbors.
Heat Advisory
Heat Advisory issued September 2 at 5:51PM EDT until September 4 at 8:00PM EDT by NWS Wilmington OH
WHAT Heat index values of 100 to 105 expected.
WHERE Portions of east central and southeast Indiana, northeast and northern Kentucky, and central, south central, southwest, and west central Ohio.
WHEN Until 8 PM EDT Friday.
IMPACTS Hot temperatures and high humidity may cause heat illnesses.
Drink plenty of fluids, stay in an air-conditioned room, stay out of the sun, and check up on relatives and neighbors.
Triple-Digit Heat Grips Kentucky; Isolated Showers East
An intense late-summer heatwave will peak today as a 594dm ridge centers over the region, pushing temperatures into the upper 90s and triple digits. While western Kentucky remains dry and sunny, a weak disturbance on the ridge's periphery will trigger isolated, light rain showers and virga across the Bluegrass and Northeast regions.
Confidence Assessment
High agreement on the overall ridge strength and heat magnitude. Slight uncertainty remains regarding the exact westward extent of the evening rain showers and the influence of cloud debris on peak temperatures.
Get Personalized Forecasts
Choose which region in Kentucky you're interested in and we'll always show you that one first. You can change your selected region by clicking the "Star" icon on any regional forecast.
Purchase Area
Expect a dangerously hot day with full sunshine and temperatures reaching 100 degrees. High humidity will push the heat index into the 104-106 range.
Northwest Pennyrile
The heat will be relentless today with highs of 100 degrees. Very little wind will provide no relief from the stagnant, humid air.
Southwest Pennyrile
Temperatures will peak near 98 degrees under sunny skies. Avoid outdoor activities during the late afternoon as heat indices climb.
Barren River
Sunny skies and 98-degree heat will dominate the afternoon. Overnight lows will remain very warm, in the mid-70s.
Louisville Metro
Louisville will likely be the hottest spot in the state, reaching 101 degrees. The urban heat island will keep temperatures in the 80s well into the night.
Lincoln Trail
Expect total sunshine and temperatures reaching 98 degrees. Haze from stagnant air may be visible on the horizon.
Lake Cumberland
Temperatures will reach 98 degrees. A few clouds and a light sprinkle are possible in the afternoon, but most will stay dry.
Northern Kentucky
A mix of sun and clouds with highs near 98 degrees. A light evening shower is likely, though it will do little to break the heat.
Inner Bluegrass
Highs will reach 98 degrees in Lexington. Expect a stray light shower or two this evening, but accumulations will be around a trace.
Bluegrass Foothills
Highs near 96 degrees. Scattered clouds and a few sprinkles are possible as moisture moves in from the east.
Northeast Kentucky
Ashland will see highs near 98. Light rain showers are likely at times today, though they won't provide much water.
Southeast Kentucky
Morning valley fog will clear to a hot and humid day with temperatures in the low-to-mid 90s. Rain chances remain very low.
Possible Outcomes
Weather forecasting involves uncertainty. Below are two scenarios representing the range of possible outcomes: the "Boom" scenario shows the worst-case/highest-impact result if conditions align unfavorably, while the "Bust" scenario shows the best-case/lowest-impact result if the forecast doesn't materialize as expected.
The 'Boom' Scenario
If the mid-level cap weakens slightly and moisture pooling exceeds current models, scattered thunderstorms could develop in the Bluegrass, providing localized wind threats and temporary heat relief. Temperatures would maximize at 102-104 in urban corridors.
The 'Bust' Scenario
If thicker cloud debris from the eastern disturbance drifts further west, it may shave 3-5 degrees off afternoon highs, keeping the state in the mid-90s with no triple-digit readings.
Model Disagreements
When models disagree, a call must be made to determine the most likely outcome. This decision is based on a combination of factors including model performance, historical data, and the models general accounting of each climatic region of Kentucky.
The Eastern Rain Reality
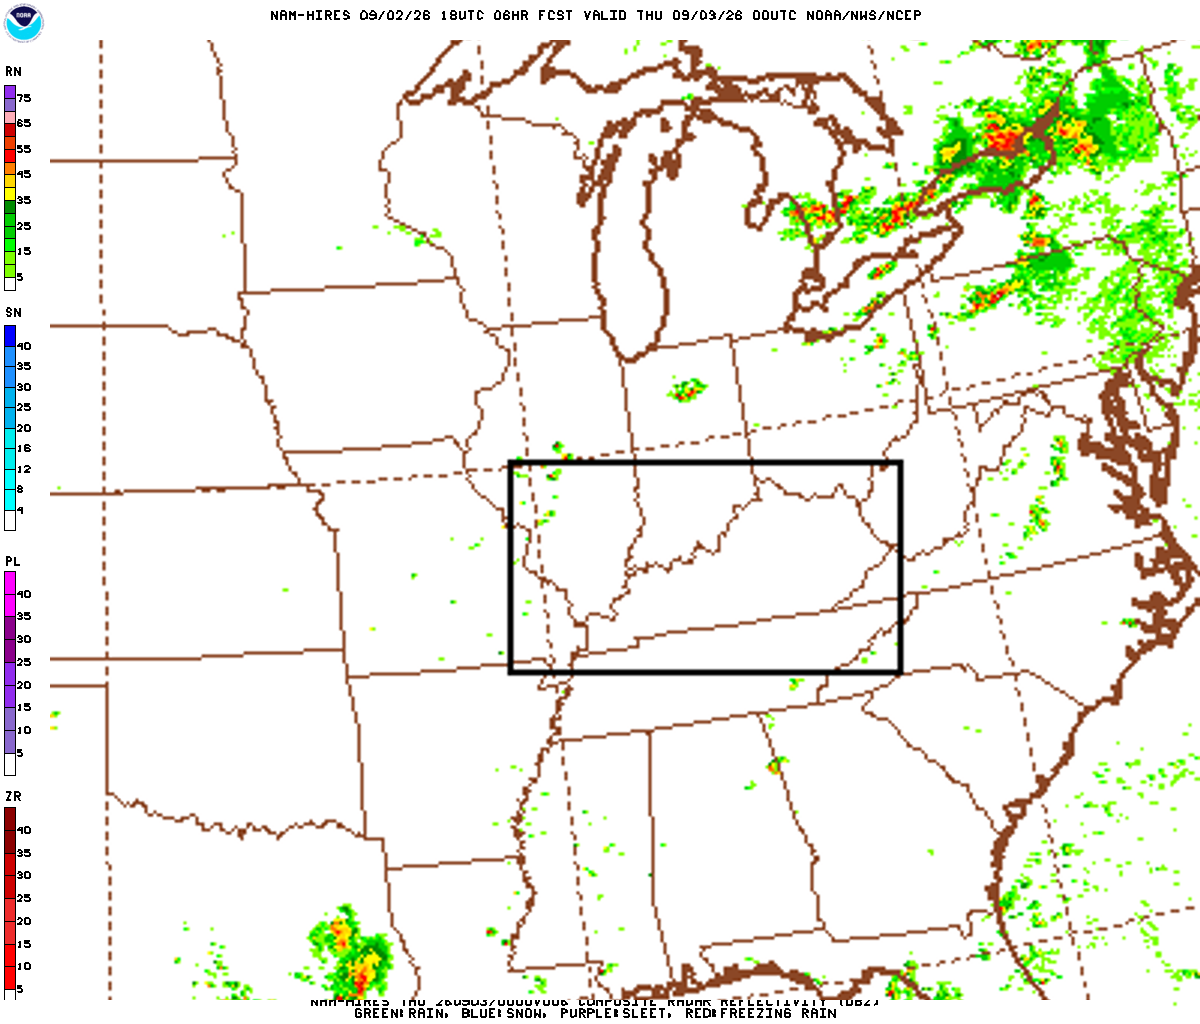
NAM maintains a completely dry forecast, whereas GFS and Euro suggest high PoPs (80%) for very light, trace-level precipitation.
Why EURO Wins
The Euro handles the inverted trough/moisture surge from the Atlantic better than the NAM's rigid subsidence cap. We expect light rain, though amounts will be minimal.
The Century Mark Conflict
GFS is aggressively pushing triple digits (100-101F) across the western half of the state, while the NAM and Euro keep highs capped at 97-98F.
Why GFS Wins
Low soil moisture and extreme 850mb thermal packing favor the higher GFS solution. NAM typically struggles with surface heating in late-summer dry regimes.
Celestial Almanac
Last Quarter
Purchase Area
Northwest Pennyrile
Southwest Pennyrile
Barren River
Louisville Metro
Lincoln Trail
Lake Cumberland
Northern Kentucky
Inner Bluegrass
Bluegrass Foothills
Northeast Kentucky
Southeast Kentucky
Forecast Charts
These maps are generated by the weather agencies based on the raw data that the weather models predict. The final forecast is generated using the same raw data shown on the map. Keep in mind that the models (and therefore the maps) will generally disagree on specific parts of the forecast. Use these as guidance - not as a final prediction.
Dive Deeper Into the Models
This forecast is a synthesis of raw data from the NAM, GFS, ECMWF, and GEM models. These models provide detailed atmospheric analyses including 500mb vorticity, precipitation rates, and more. You can take a look at the raw model data by clicking the links below.