
Monday, August 31
Late August Heatwave with Isolated Morning Sprinkles East
A strong upper-level ridge will dominate much of the Commonwealth, bringing unseasonably hot temperatures in the low-to-mid 90s. While most areas will remain dry under sunny skies, a weak mid-level disturbance will bring cloud cover and a few light morning sprinkles to the Bluegrass and Eastern Kentucky.
Confidence Assessment
Confidence is high for a hot day overall, but is reduced to 65 due to significant model disagreement regarding the magnitude of the heat (92F vs 97F) and whether the light precipitation in the East will actually reach the ground or remain as virga.
Get Personalized Forecasts
Choose which region in Kentucky you're interested in and we'll always show you that one first. You can change your selected region by clicking the "Star" icon on any regional forecast.
Purchase Area
Expect a bright and sweltering day across the far west. Temperatures will climb into the mid-90s with plenty of sunshine.
Northwest Pennyrile
Sunny and hot conditions will prevail throughout the day. Temperatures will reach the mid-90s.
Southwest Pennyrile
A typical late-August day with clear skies and heat. Highs will settle in the lower 90s.
Barren River
Conditions will be dry and hot with full sunshine. Highs will reach near 93 degrees.
Louisville Metro
The city will experience intense heat with highs near 95. Expect mostly sunny skies after some morning clouds.
Lincoln Trail
Sunshine will dominate with temperatures in the low 90s. A light breeze will offer little relief from the heat.
Lake Cumberland
A beautiful and hot day for the lake. Temperatures will reach the lower 90s under clear skies.
Northern Kentucky
Temperatures will spike into the mid-90s today. Expect clear skies for the afternoon commute.
Inner Bluegrass
A few light morning sprinkles are possible before the sun takes over. Temperatures will reach the lower 90s by the afternoon.
Bluegrass Foothills
Morning clouds will give way to a sunny and warm afternoon. Highs will be near 91 degrees.
Northeast Kentucky
A few morning showers are possible, followed by a warm and sunny afternoon. Temperatures will reach the low 90s.
Southeast Kentucky
Expect a damp morning with light rain, clearing up by midday. Afternoon highs will be comfortable near 89 degrees.
Possible Outcomes
Weather forecasting involves uncertainty. Below are two scenarios representing the range of possible outcomes: the "Boom" scenario shows the worst-case/highest-impact result if conditions align unfavorably, while the "Bust" scenario shows the best-case/lowest-impact result if the forecast doesn't materialize as expected.
The 'Boom' Scenario
If the GFS scenario verifies, the ridge suppresses all cloud cover, leading to widespread upper-90s and localized triple-digit heat indices in urban corridors like Louisville and Northern Kentucky.
The 'Bust' Scenario
If the NAM's moisture profile is more robust, morning cloud cover lingers into the afternoon across Central Kentucky, holding temperatures in the mid-80s and allowing light rain to measurable more than just a trace in the East.
Model Disagreements
When models disagree, a call must be made to determine the most likely outcome. This decision is based on a combination of factors including model performance, historical data, and the models general accounting of each climatic region of Kentucky.
The Eastern Virga Conflict
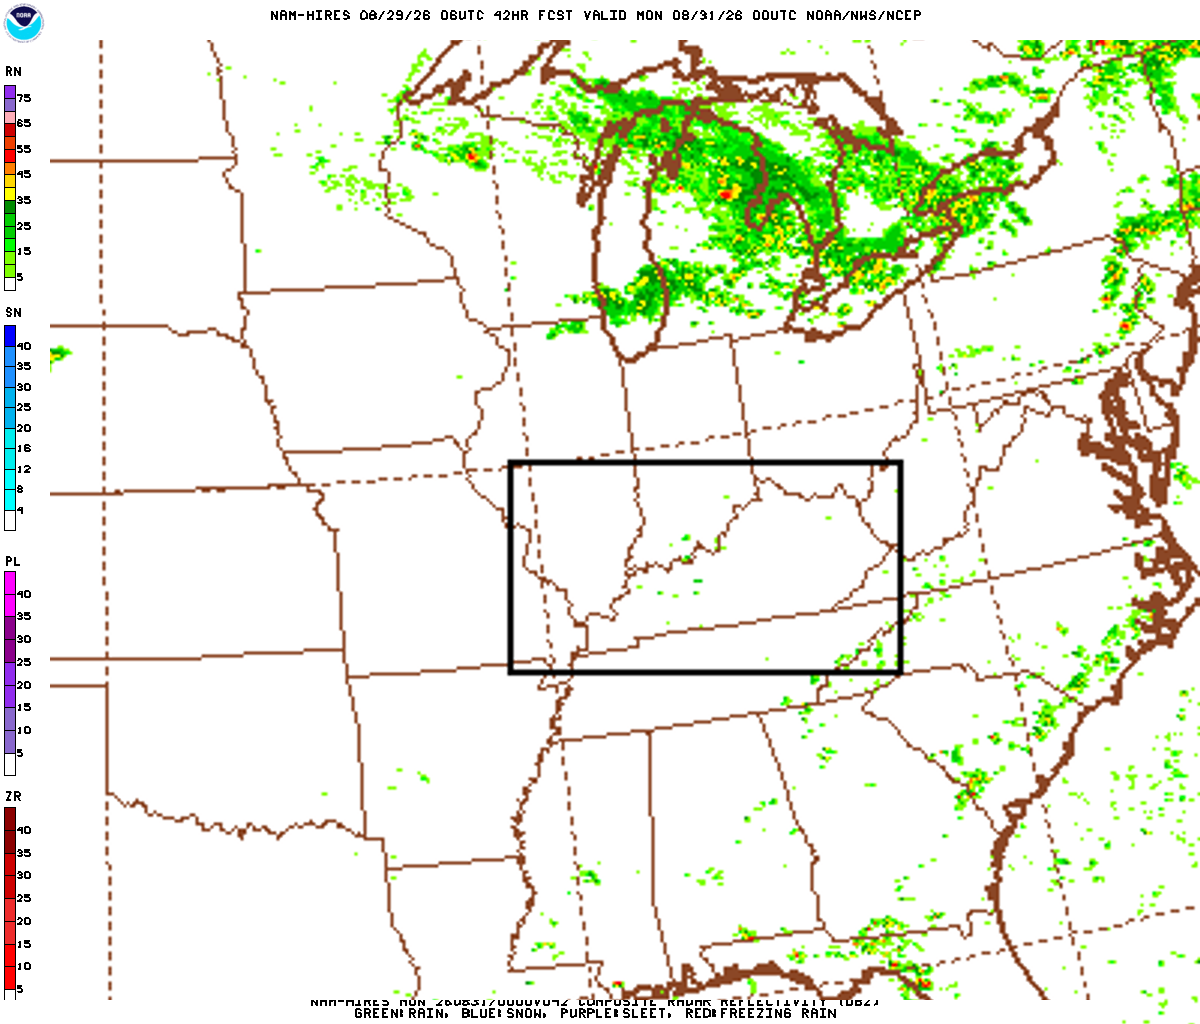
NAM and Euro show a high-probability (80%+) of precipitation in the East, but with QPF values under 0.02 inches, suggesting a significant struggle against dry low-level air.
Why NAM Wins
The NAM typically handles the shallow moisture and orographic influences in Eastern Kentucky better than global models. Even if only trace amounts occur, the NAM's recognition of the shortwave is more physically sound than the GFS's total dryness.
The Great Heat Disparity
The GFS is an aggressive outlier, pushing surface temperatures into the upper 90s (96-98F), while the NAM and Euro suggest mid-level cloud cover will keep most areas capped in the 91-94F range.
Why BLEND Wins
The GFS appears to be over-modeling the subsidence warming by ignoring the mid-level moisture plume identified by both the NAM and Euro. A blend favoring the Euro/NAM temperature curve is more realistic given the projected cloud cover.
Celestial Almanac
Waning Gibbous
Purchase Area
Northwest Pennyrile
Southwest Pennyrile
Barren River
Louisville Metro
Lincoln Trail
Lake Cumberland
Northern Kentucky
Inner Bluegrass
Bluegrass Foothills
Northeast Kentucky
Southeast Kentucky
Forecast Charts
These maps are generated by the weather agencies based on the raw data that the weather models predict. The final forecast is generated using the same raw data shown on the map. Keep in mind that the models (and therefore the maps) will generally disagree on specific parts of the forecast. Use these as guidance - not as a final prediction.
Dive Deeper Into the Models
This forecast is a synthesis of raw data from the NAM, GFS, ECMWF, and GEM models. These models provide detailed atmospheric analyses including 500mb vorticity, precipitation rates, and more. You can take a look at the raw model data by clicking the links below.