
Wednesday, September 9
Late Summer Heat West, Nuisance Drizzle East
A sharp divide will define Kentucky's weather on September 9th. Western and Central regions will experience unseasonably hot and humid conditions under a stagnant ridge, while Eastern Kentucky deals with persistent cloud cover and light, non-impactful drizzle as a weak shortwave brushes the region.
Confidence Assessment
High confidence exists for the heat in the west. Confidence is lower for eastern precipitation reaching the ground due to significant dry air in the lower 3,000 feet of the atmosphere.
Get Personalized Forecasts
Choose which region in Kentucky you're interested in and we'll always show you that one first. You can change your selected region by clicking the "Star" icon on any regional forecast.
Purchase Area
Clear skies and hot conditions will dominate the day. Highs will reach the mid-94s with high humidity making it feel closer to 100 degrees.
Northwest Pennyrile
Expect a hot day with plenty of sunshine. Temperatures will peak around 92 degrees in the afternoon.
Southwest Pennyrile
A quiet and hot day is in store with clear skies from start to finish. Highs will be near 92.
Barren River
Sun will be the main feature of the day, though some occasional clouds may drift in from the east. Highs around 91.
Louisville Metro
Cloud cover will be more prevalent here than to the west, but it will remain dry and quite warm with a high of 92.
Lincoln Trail
Mostly cloudy skies with a few morning sprinkles possible. Any rainfall will be extremely light, around 0.01 inches.
Lake Cumberland
A mix of clouds and sun with warm temperatures. Rain is unlikely to reach the ground.
Northern Kentucky
Mostly cloudy and warm. While the radar may show light activity, very little if any rain will reach the ground.
Inner Bluegrass
Occasional light rain or drizzle is expected through the afternoon. Accumulations around 0.02 inches.
Bluegrass Foothills
Cloudy skies and high humidity with light drizzle throughout the day. Accumulations around 0.01 inches.
Northeast Kentucky
The dampest part of the state today. Expect light rain and steady clouds. Accumulations around 0.03 inches.
Southeast Kentucky
Mountain valleys will see persistent clouds and periods of light drizzle. Accumulations around 0.02 inches.
Possible Outcomes
Weather forecasting involves uncertainty. Below are two scenarios representing the range of possible outcomes: the "Boom" scenario shows the worst-case/highest-impact result if conditions align unfavorably, while the "Bust" scenario shows the best-case/lowest-impact result if the forecast doesn't materialize as expected.
The 'Boom' Scenario
If the moisture axis shifts 50 miles further west and the shortwave deepens, cloud cover could suppress temperatures in the Louisville and Barren River areas into the mid-80s, while rainfall totals in the East could reach a more measurable 0.10 inches.
The 'Bust' Scenario
If the western ridge proves more aggressive, dry air will erode the moisture tongue in the East, resulting in a completely dry day for the entire state with temperatures in the Purchase region potentially overachieving into the upper 90s.
Model Disagreements
When models disagree, a call must be made to determine the most likely outcome. This decision is based on a combination of factors including model performance, historical data, and the models general accounting of each climatic region of Kentucky.
The Western Cloud Fringe
There is a dispute over how far west the mid-level cloud deck will penetrate. The NAM is more aggressive with clearing, while the Euro keeps clouds over the I-65 corridor for much of the morning.
Why EURO Wins
The Euro's steady-hand approach to stagnant ridge patterns typically excels at predicting the slow erosion of cloud decks on the periphery of high pressure.
The Virga vs. Value Conflict
A significant discrepancy exists between high probability of precipitation (PoP) and negligible liquid totals (QPF). Models like the GFS tend to 'smear' light rain across too wide an area, whereas the Euro suggests a more focused but extremely light drizzle event.
Why EURO Wins
The ECMWF handles the dry low-level sub-cloud layer more realistically, correctly identifying that while it may look like rain on radar, the high dewpoint depressions will result in minimal accumulation at the surface.
Celestial Almanac
Waning Crescent
Purchase Area
Northwest Pennyrile
Southwest Pennyrile
Barren River
Louisville Metro
Lincoln Trail
Lake Cumberland
Northern Kentucky
Inner Bluegrass
Bluegrass Foothills
Northeast Kentucky
Southeast Kentucky
Forecast Charts
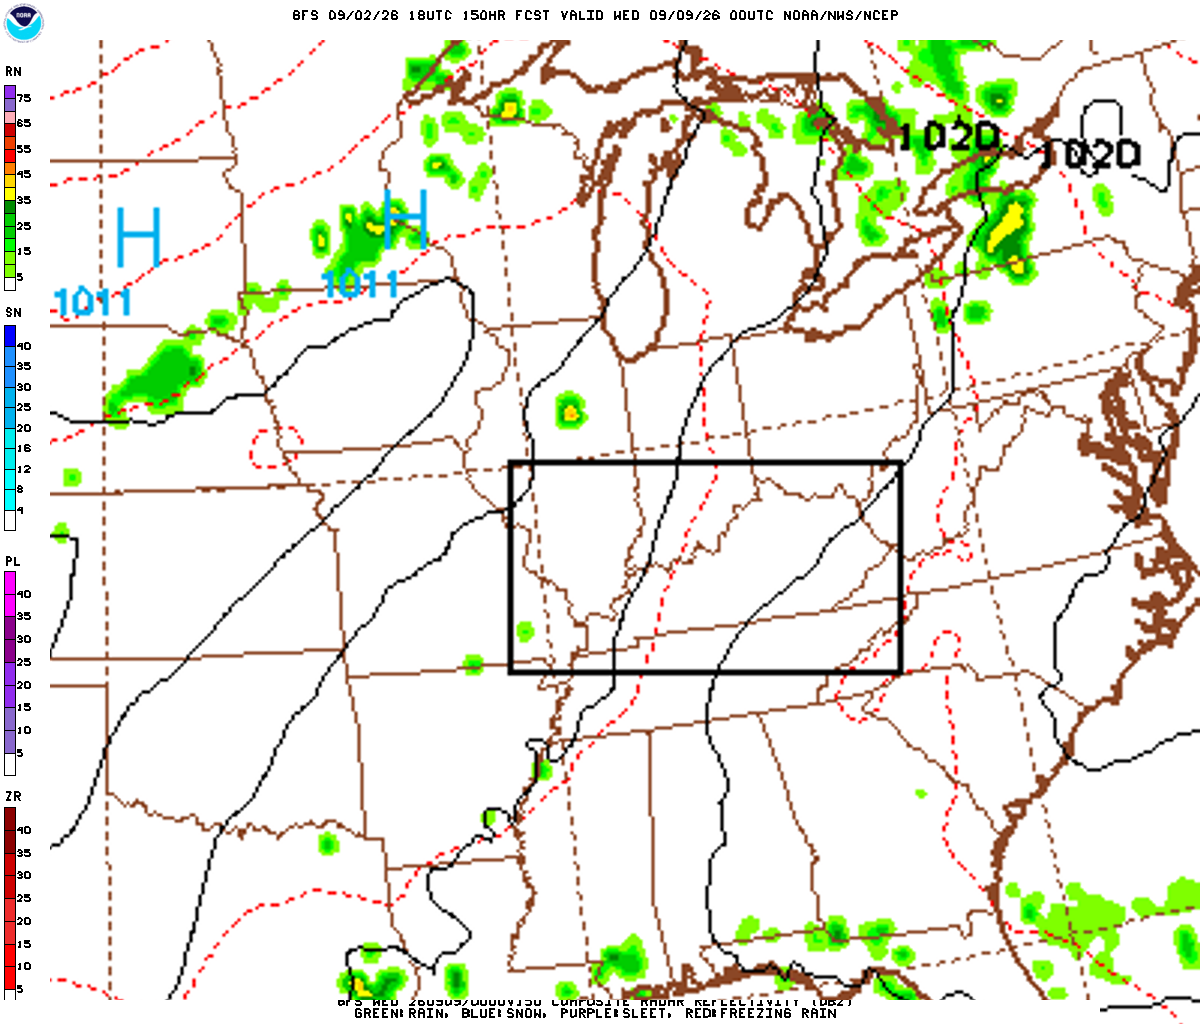
These maps are generated by the weather agencies based on the raw data that the weather models predict. The final forecast is generated using the same raw data shown on the map. Keep in mind that the models (and therefore the maps) will generally disagree on specific parts of the forecast. Use these as guidance - not as a final prediction.
Dive Deeper Into the Models
This forecast is a synthesis of raw data from the NAM, GFS, ECMWF, and GEM models. These models provide detailed atmospheric analyses including 500mb vorticity, precipitation rates, and more. You can take a look at the raw model data by clicking the links below.